


What is a Bitcoin Rainbow Chart? A Beginner's Guide - ZELTA
Bitcoin, introduced in 2009, has become widely recognized and favored as a cryptocurrency. It stands out with its decentralized nature, limited availability, and robust security measures.
It has gained significant media attention and attracted investors and traders globally.
Click here to learn why Bitcoin is a good investment
Yet, do you ever wonder if there can be something really constraining about it, which is blocking the pathway of a lot of people interested in it?
It is basically the difficulty you are getting in following the historical trends in Bitcoin due to its extremely erratic price changes, so the developers came up with a concept named the Bitcoin Rainbow Chart which is very helpful in this situation.
So, let’s move ahead and understand what these rainbow charts crypto actually are.
(But before that, be sure to give it a try on Zelta.io, a platform with zero trading fees* and an extensive selection of over 200 cryptocurrencies to trade.)
What is Bitcoin Rainbow chart?
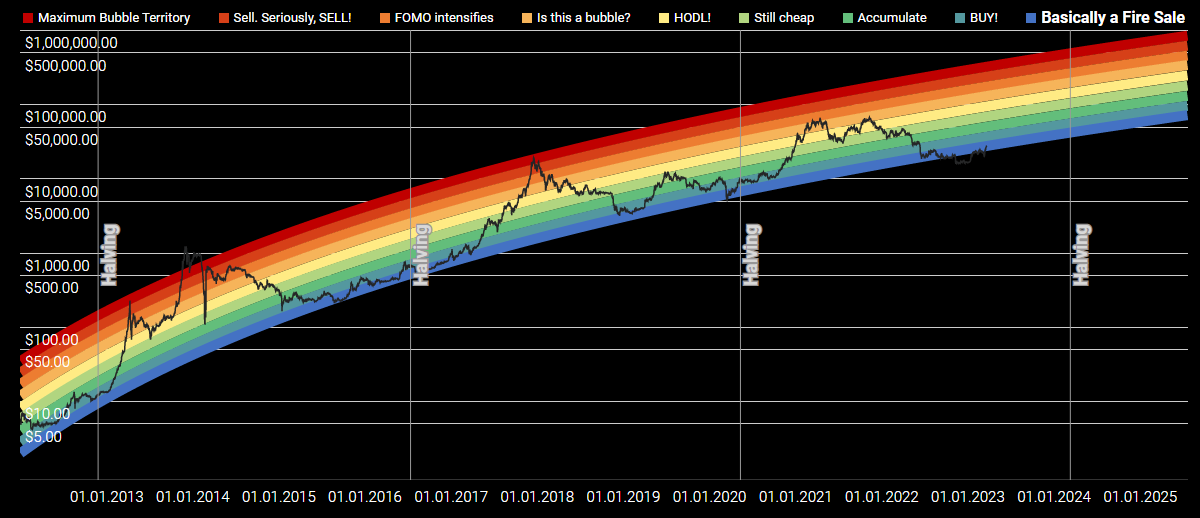
The word chart itself gives you hints about its characteristics but in general, an illustration of the price changes or fluctuations of Bitcoin over time is called a Bitcoin Rainbow Chart.
Click here to learn about Longing and Shorting
It is a colour scheme graph that assists buyers and sellers in spotting movements and trends in Bitcoin's earlier market volatility and will regardlessly help them with their ideology on how & when to mark a move in bitcoin’s market.
A combination of various colours is used in the graph to depict various price fluctuations across time, with dark red designating low costs and bright green designating inflated prices.
For investors and traders who want to analyze previous Bitcoin price trends, the Bitcoin Rainbow Chart is an important element. Therefore, you can take a look before possible purchasing or trading possibilities so that you can create prudent choices regarding investments.
Now, moving ahead, let's understand how these charts generally work.
How Does It Work?
In simple terms, the Bitcoin Rainbow Chart uses a horizontal scale to show time and a vertical scale to represent the price of bitcoin. Each shade on the chart indicates a specific price range. It's like painting a picture of bitcoin's price journey over time.
For instance, red might represent a price bracket below $10,000, whereas green might stand with one between $20,000 and $40,000.
An evolution or change of colours will be visible on the chart as the cost of Bitcoin increases or decreases over time, such colour changes mark the fluctuations happening.
Hence, these charts' colour changes can be used by various investors as well as traders to spot trends and patterns in Bitcoin's previous price alterations.
The price of bitcoin may be in a bullish trend, for instance, if the chart displays a pattern of vivid green. On the other hand, if the chart displays a structure of deep red, it can be a sign that the price of bitcoin is in a bear market. Here, the colour is the key to the whole process.
You can look for prospective purchase and sale possibilities with the Bitcoin Rainbow Chart. For instance, if the price of Bitcoin has entered a bear market as well as the chart shows a trend of dark red, it might be a good idea to buy Bitcoin at a discount.
Similarly to this, if indeed the chart shows a trend of dark green and the bitcoin price is rising, it might be a prudent move to exchange it for a bigger sum. Now, this summonses what Bitcoin Rainbow charts are and how they actually work. Let’s get forward and understand rainbow charts in general.
Rainbow Chart Crypto
Other cryptocurrencies, such as Litecoin, Bitcoin Cash, and Ripple also have their own rainbow charts in addition to Bitcoin and Ethereum. The above charts function similarly to the Rainbow Charts for Bitcoin and Ethereum, but they show previous price fluctuations for many cryptocurrencies. For investors and traders who would like to research previous cryptocurrency price trends, rainbow graphs are a key tool. They can help in identifying trends and patterns in price fluctuations and identify possible purchasing or selling possibilities, which will ultimately help you a lot in understanding the market.
Now, since we are talking about cryptos in general let’s understand and take a look into another famous cryptocurrency known for its large user base.
Ethereum Rainbow Chart
Yes, we will be discussing Ethereum here. The second-most prominent cryptocurrency in the world, Ethereum, has a comparable graphic named the Ethereum Rainbow Chart that illustrates its historical price modifications. The Ethereum Rainbow Chart employs a variety of colours to depict various price fluctuations over time, similar to the Bitcoin Rainbow Chart.
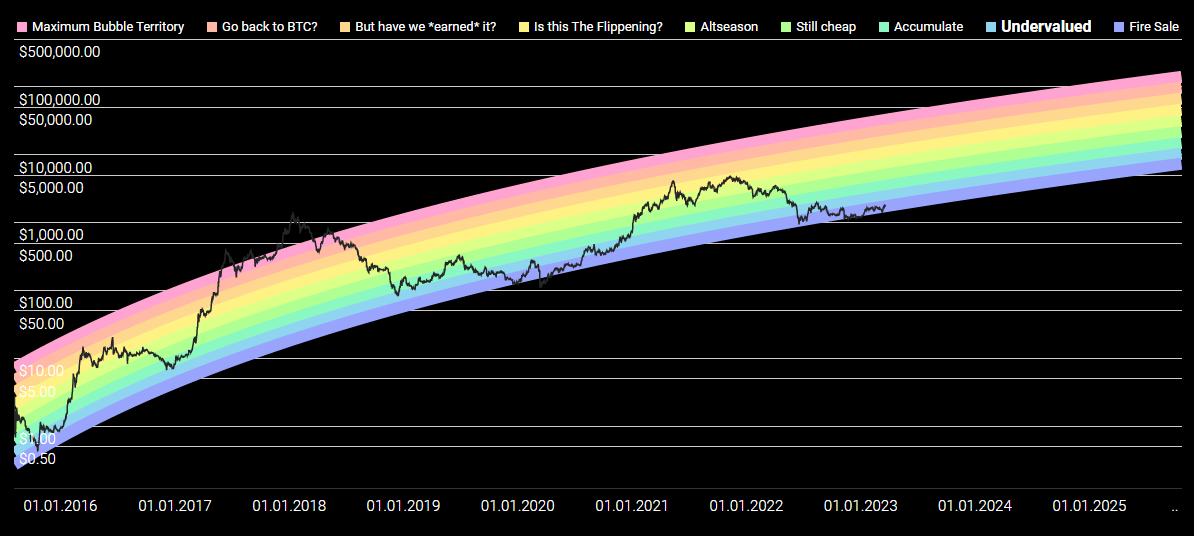
Investors and traders can analyze recent Ethereum market prices and identify possible purchasing or selling possibilities via the Ethereum Rainbow Chart. To make knowledgeable investing decisions, the chart can also be utilized in conjunction with other technical and fundamental analysis methods and this makes it easy for you to trade and get hands-on in the crypto market.
Conclusion
In conclusion, the Bitcoin Rainbow Chart is a vital tool for buyers and sellers who wish to study the historical trends of Bitcoin and other cryptocurrencies. It makes use of a colour palette to represent different price changes over time and aids in the discovery of patterns and developments.
Studying the historical price changes of Ethereum may also be done with the help of the Ethereum Rainbow Chart, a related image for the cryptocurrency. These charts, coupled with additional tools for technical and fundamental research, can help you choose which cryptocurrencies to buy and sell.
For anyone with an interest in the cryptocurrency market, the rainbow charts are a great resource. You should always keep in mind that you can’t entirely depend on these rainbow charts and make the decision for the steps you will take in the industry.
Trade Bitcoin and 200+ other coin with 0 fees* on Zelta.io.